Imagine two households with the same daily spending. One has a secure roof, a working tap and a nearby school. The other faces eviction, buys water by the container and loses working hours reaching essential services. Their monetary circumstances might look similar in a table. Their ability to turn money into a stable life could be very different.
That distinction sits at the heart of this year’s International Day for the Eradication of Poverty, observed on October 17. The UN’s 2026 focus, “Safe Homes for All,” links housing insecurity to the wider cycle of deprivation. It also offers a useful way to read the poverty numbers: understand the instrument before deciding what its reading proves.

What three dollars means
In June 2025, the World Bank updated its international extreme-poverty line from $2.15 to $3 per person per day. Those amounts belong to different price systems: 2017 and 2021 purchasing power parities, respectively. The revision was announced last year; it is not a new threshold introduced for the October 17 observance.
A purchasing-power-adjusted dollar is a common measuring unit. It allows researchers to compare household income or consumption across countries while accounting for differences in what money buys. It is not an instruction to exchange three US dollars at a bank each morning. Nor does the line mean that everyone just above it can afford a secure or adequate life.
The Bank also uses $4.20 and $8.30 lines associated with lower-middle-income and upper-middle-income economies. These reflect different national poverty standards. A global minimum enables comparison; it cannot settle every question about deprivation in a particular place. National measures and local conditions remain essential to deciding whom a policy should reach.
The revision that did not happen overnight
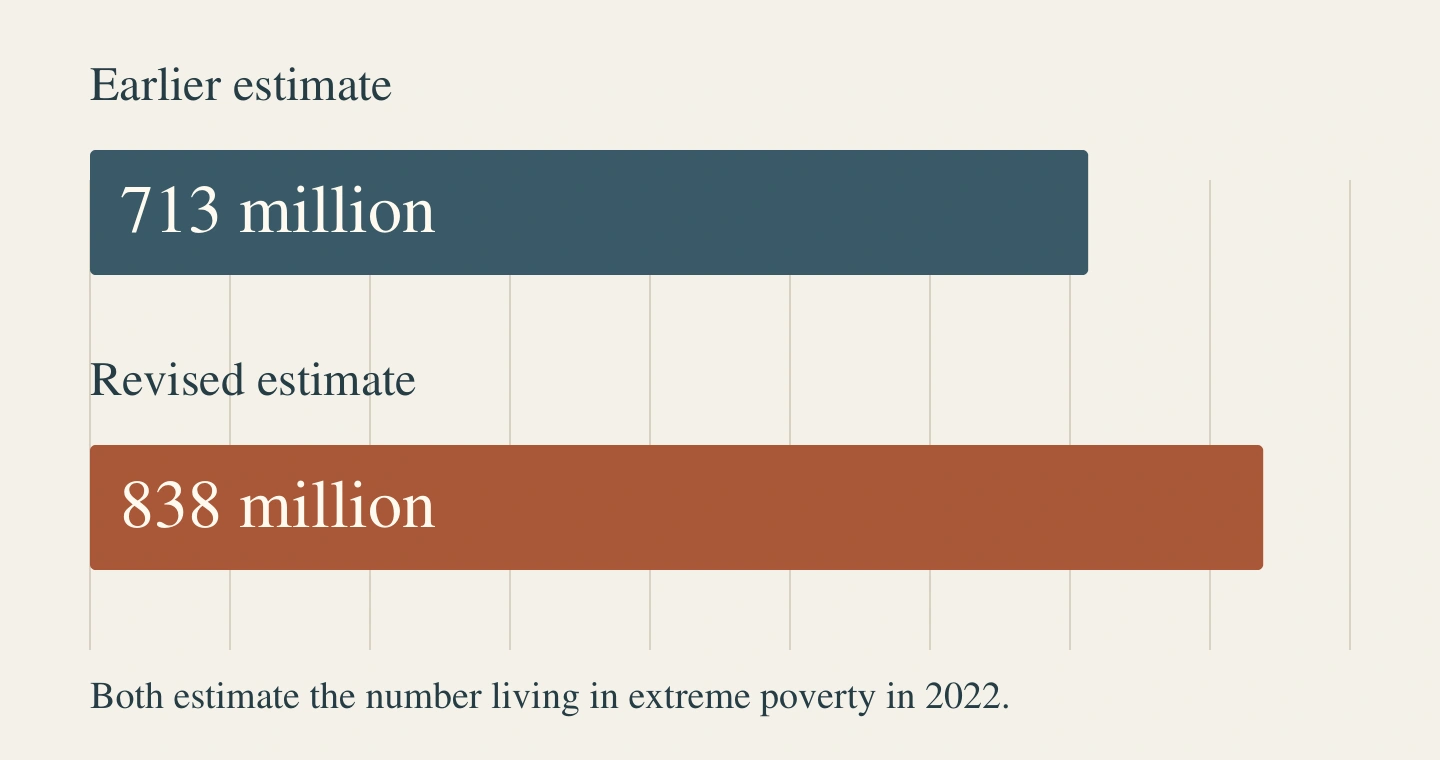
The 2025 update produced a striking comparison. The World Bank’s estimate of people living in extreme poverty in 2022 rose from about 713 million in its September 2024 data release to 838 million in its June 2025 release. The associated estimated share of the world’s population changed from 9.0 to 10.5 percent. Both readings describe the same reference year.
The Bank’s explanation identifies three interacting changes: new price comparisons, updated poverty lines and revised household-survey evidence, including important new information from India. The difference does not show 125 million people suddenly becoming poorer when the announcement appeared. It changes the assessment of how many people met the definition in an earlier year.
That distinction does not make the revision trivial. A better estimate can change the scale or location of a policy challenge. But a comparison between statistical releases answers a different question from a comparison across years using a consistent method. Before reading a rising total as deterioration, ask whether the population’s circumstances, the measurement or both have changed.
A new report, with older observation dates
This week supplied another reason for that discipline. On October 12, UNDP and Oxford’s poverty research initiative published their 2026 multidimensional poverty update, reporting about 1.2 billion people in acute multidimensional poverty. Its coverage is 108 developing countries with a combined population of 6.3 billion. It measures overlapping hardships rather than applying a daily monetary line.
The release reports a higher headcount than the previous update. Its explanation matters: in 95 countries without new survey data, updated population estimates alone added 15.8 million to the count. Other changes combine shifts in deprivation, demographics and indicator coverage. A larger number of people and a larger proportion of people are not interchangeable findings.
According to the 2026 methodology FAQ, the underlying surveys span 2014–2025. Headcounts use 2024 populations, applying survey-derived poverty rates to that population year. The publication date therefore does not turn the whole dataset into a simultaneous portrait of households in October 2026. Survey dates belong beside the headline, not buried beneath it.
Ten indicators, three dimensions
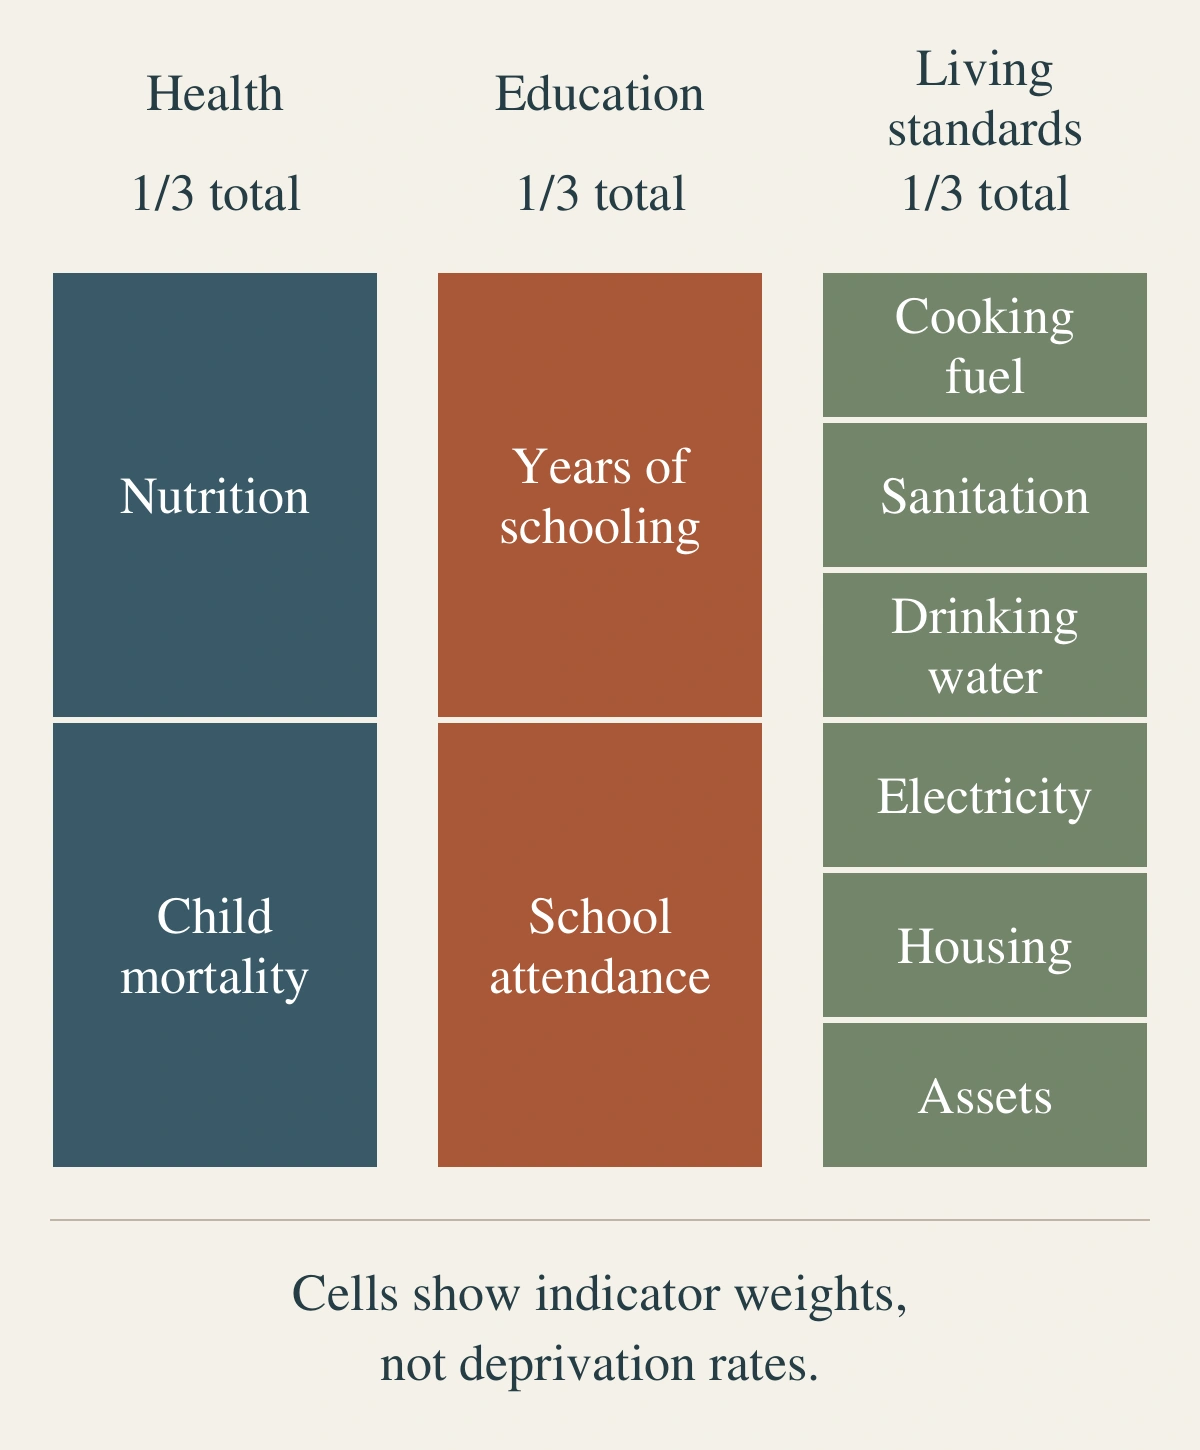
The global Multidimensional Poverty Index groups ten indicators into health, education and living standards. Nutrition and child mortality sit in health; years of schooling and school attendance in education. Cooking fuel, sanitation, drinking water, electricity, housing and assets make up living standards. Each dimension receives one-third of the total weight, divided equally among its indicators.
A household qualifies when its deprivations reach at least one-third of the weighted total. That is not simply three items out of ten: the indicators carry different weights. This measure can reveal problems hidden by a monetary total, but it cannot capture everything. Its documented limitations include inequalities within households and missing information on empowerment. No index makes a complete biography.
The house behind the headline
Housing illustrates the remaining gap. In the global MPI, the housing indicator concerns inadequate floor, wall or roof materials. A home can satisfy that particular test while its occupants still face unaffordable rent or insecure tenure. The UN Secretary-General’s message for October 17 explicitly places those pressures within the cycle that pushes people deeper into poverty.
The practical conclusion is to keep several questions open at once. Are household resources improving? Are essential services available? Are gains secure against a rent increase, illness or displacement? And do the people affected recognize the supposed improvement in their own lives? The UN’s account of the observance places their participation at the center of decisions affecting them.
A poverty line is valuable because it makes a defined problem visible and comparable. Its limits become dangerous when crossing it is mistaken for completing the job. The number should help locate the next question: what would make this household’s life genuinely more secure?